 Image: braham-map-3000-9000
CenturyLink’s Braham Exchange
Braham is located in east central Minnesota directly north of Minneapolis-St. Paul. The exchange straddles four counties – Chisago, Isanti, Kanabec and Pine. It is farther north than the Lindstrom exchange, considerably more rural (less densely populated) and observably less prosperous.
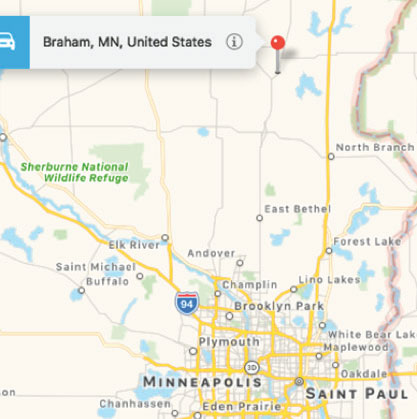
While data is not available by exchange, city data indicates that both income and house values are lower here than in the Lindstrom area. Population growth is slower here. Braham is classified as 100 percent rural whereas Lindstrom is only 6 percent rural; there is little, if any, pressure here for suburban-like development. The distance to the Twin Cities is greater so residents are more likely to be employed locally in the small regional center communities of Cambridge, Pine City, North Branch and Mora. xvii
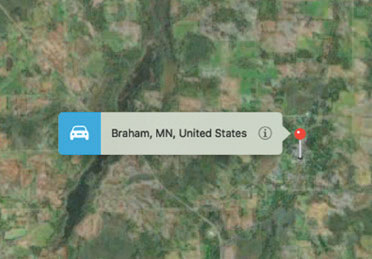
This satellite picture shows small towns (Braham is the largest community and has just under 2,000 people), wetlands, small lakes and relatively small farms. There are also significant numbers of people living in the rural countryside distributed along county and township roads.
While business development opportunities for CenturyLink in the Braham exchange may seem limited, the City of Braham recently partnered with a smaller wireless ISP to bring fiber-based Internet services to their new business park on the north side of Braham in response to the location requirements of a prospective business park tenant.
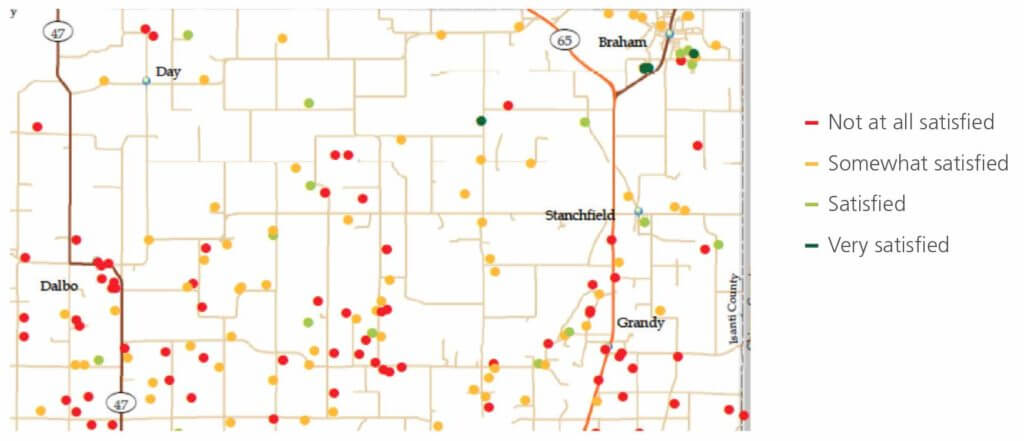
Results from an Isanti countywide broadband survey conducted by Design Nine, a national broadband consulting firm in fall/winter of 2017, also suggest a need for network improvements. The map below of survey results illustrates customer broadband satisfaction in the Isanti County portion of the Braham exchange. Red and gold colors indicate dissatisfaction or lower satisfaction.
CenturyLink’s Infrastructure Investment Strategy
CenturyLink has focused its CAF II infrastructure investments in the more densely populated portions of the Braham exchange. Most of the identified deployment is in the eastern and southern portions of the exchange.
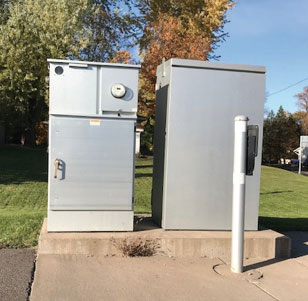
While new fiber routes were clearly marked with the traditional white and orange posts, large areas of the exchange seem to depend on buried copper lines. Based on the “buried cable” warning signs and the older pedestals, industry experts consulted for this study advised that fiber connectivity was highly unlikely.
A variety of equipment has been installed, seemingly dependent on population density. In the denser areas, DSLAMs were larger with varying numbers of ports. In the less dense areas, 24 port DSLAMS were common.
In the field, we saw equipment that was new and some DSLAMs that appeared to be older and to have been installed in earlier years. In some areas west of Highway 65, DSLAMs appeared to be connected to copper lines rather than fiber. Given their apparent age, it is likely that these older DSLAMs might be fed by bonded T-1 lines with far less bandwidth capacity than new fiber-fed DSLAMs. It is also possible that some of these older DSLAMs were taken out of service, but not removed, when the new equipment was installed. This is most likely to have occurred in the areas on the map below where the DSLAMs are quite close together. Compared to Frontier’s Lindstrom exchange, CenturyLink has numerous interlocking red circles on the map below, with DSLAMs located less than one mile apart. Unfortunately, it was not possible to determine which, if any, DSLAMs are now inactive. Because neither provider responded to requests for comments and corrections on this report, our conclusions are based on observations of field deployments.
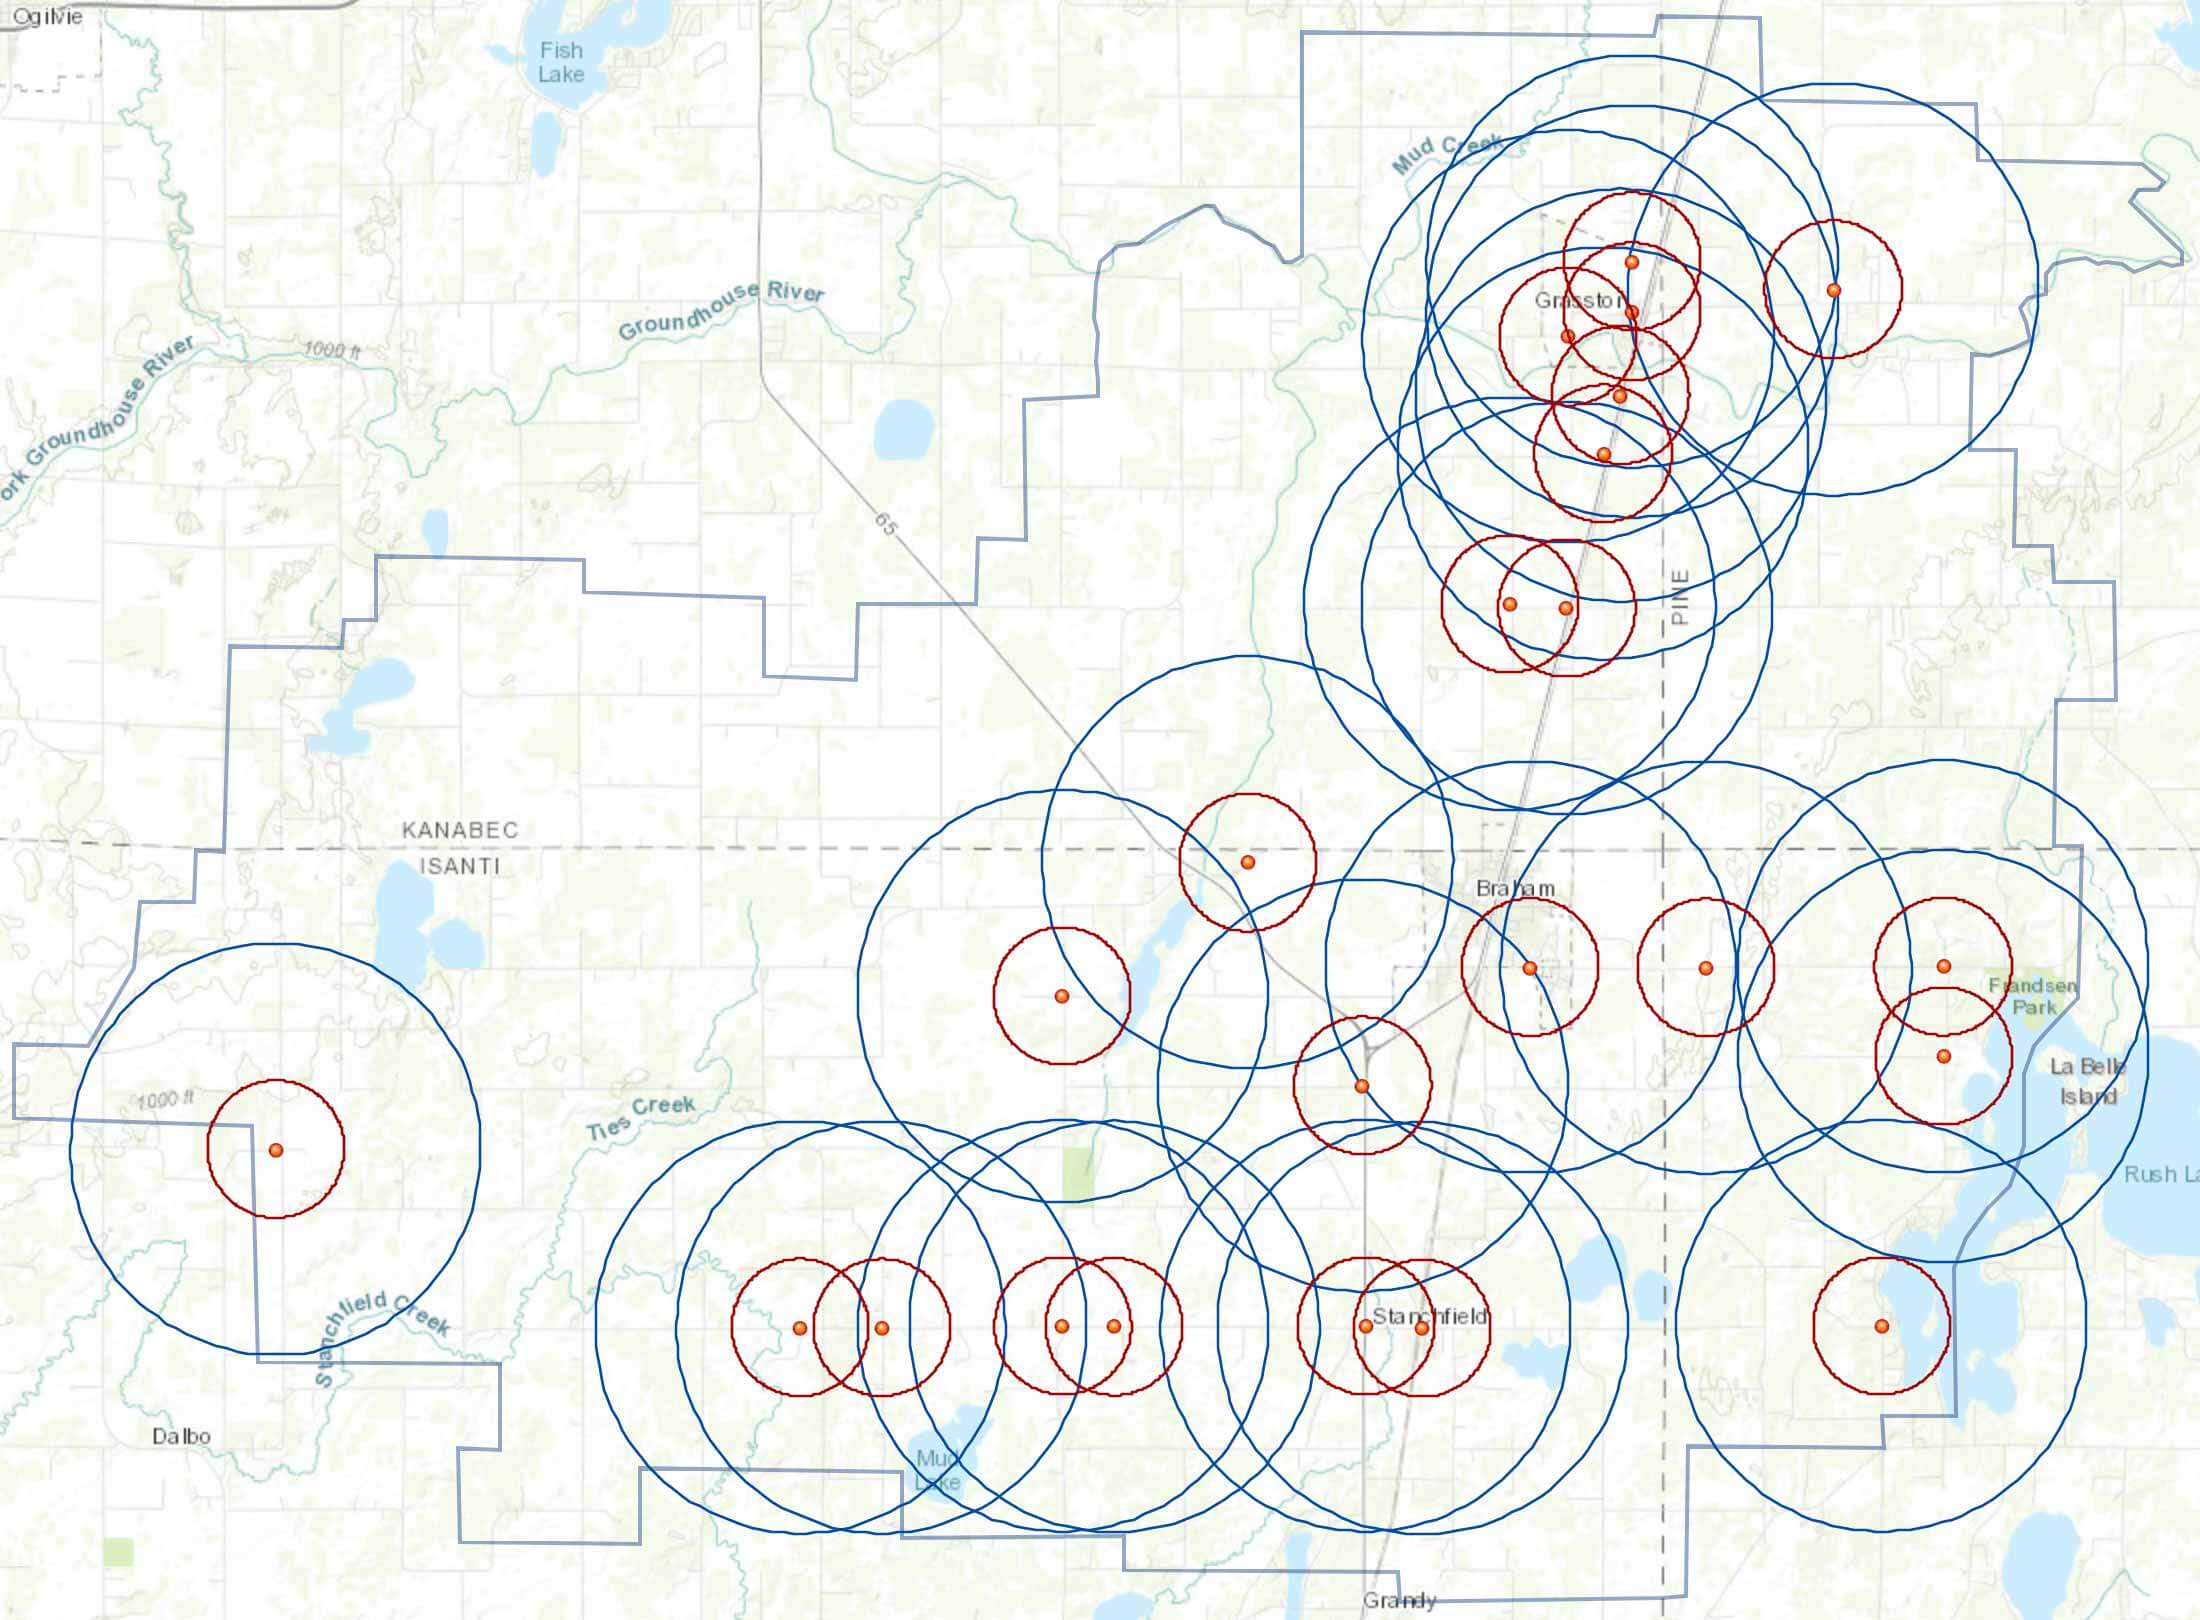
| Distance from node | Broadband speeds | Color on map |
| Less than 3,000 ft | 25 Mb /3 Mb | Red Circle |
| Less than 9,000 ft | 10 Mb /1 Mb | Blue Circle |
Reviewing the map above, the following characteristics emerge in the Braham exchange:
- Significant portions of the Braham exchange are outside of the blue circles indicating that less than 10 Mbps/1 Mbps Internet service would be available to residents and businesses in these locations.
- In the areas where CAF II investments were made, there is relatively consistent coverage within the 9,000- foot radius circles. This suggests that where there is a concentration of improvements, customers should have access to sustained 10 Mbps/1 Mbps speeds based on overlap of the 9,000-foot radius circles.
The map below shows the relatively limited areas to receive broadband coverage of at least 25 Mbps/3 Mbps as a result of CenturyLink’s CAF II-funded upgrades to date. Again, note that actual speeds within these red circles could range up to 80 Mbps depending on proximity to electronics, vectoring and pair bonding. Vectoring is generally not effective at distances greater than 3,000 feet.
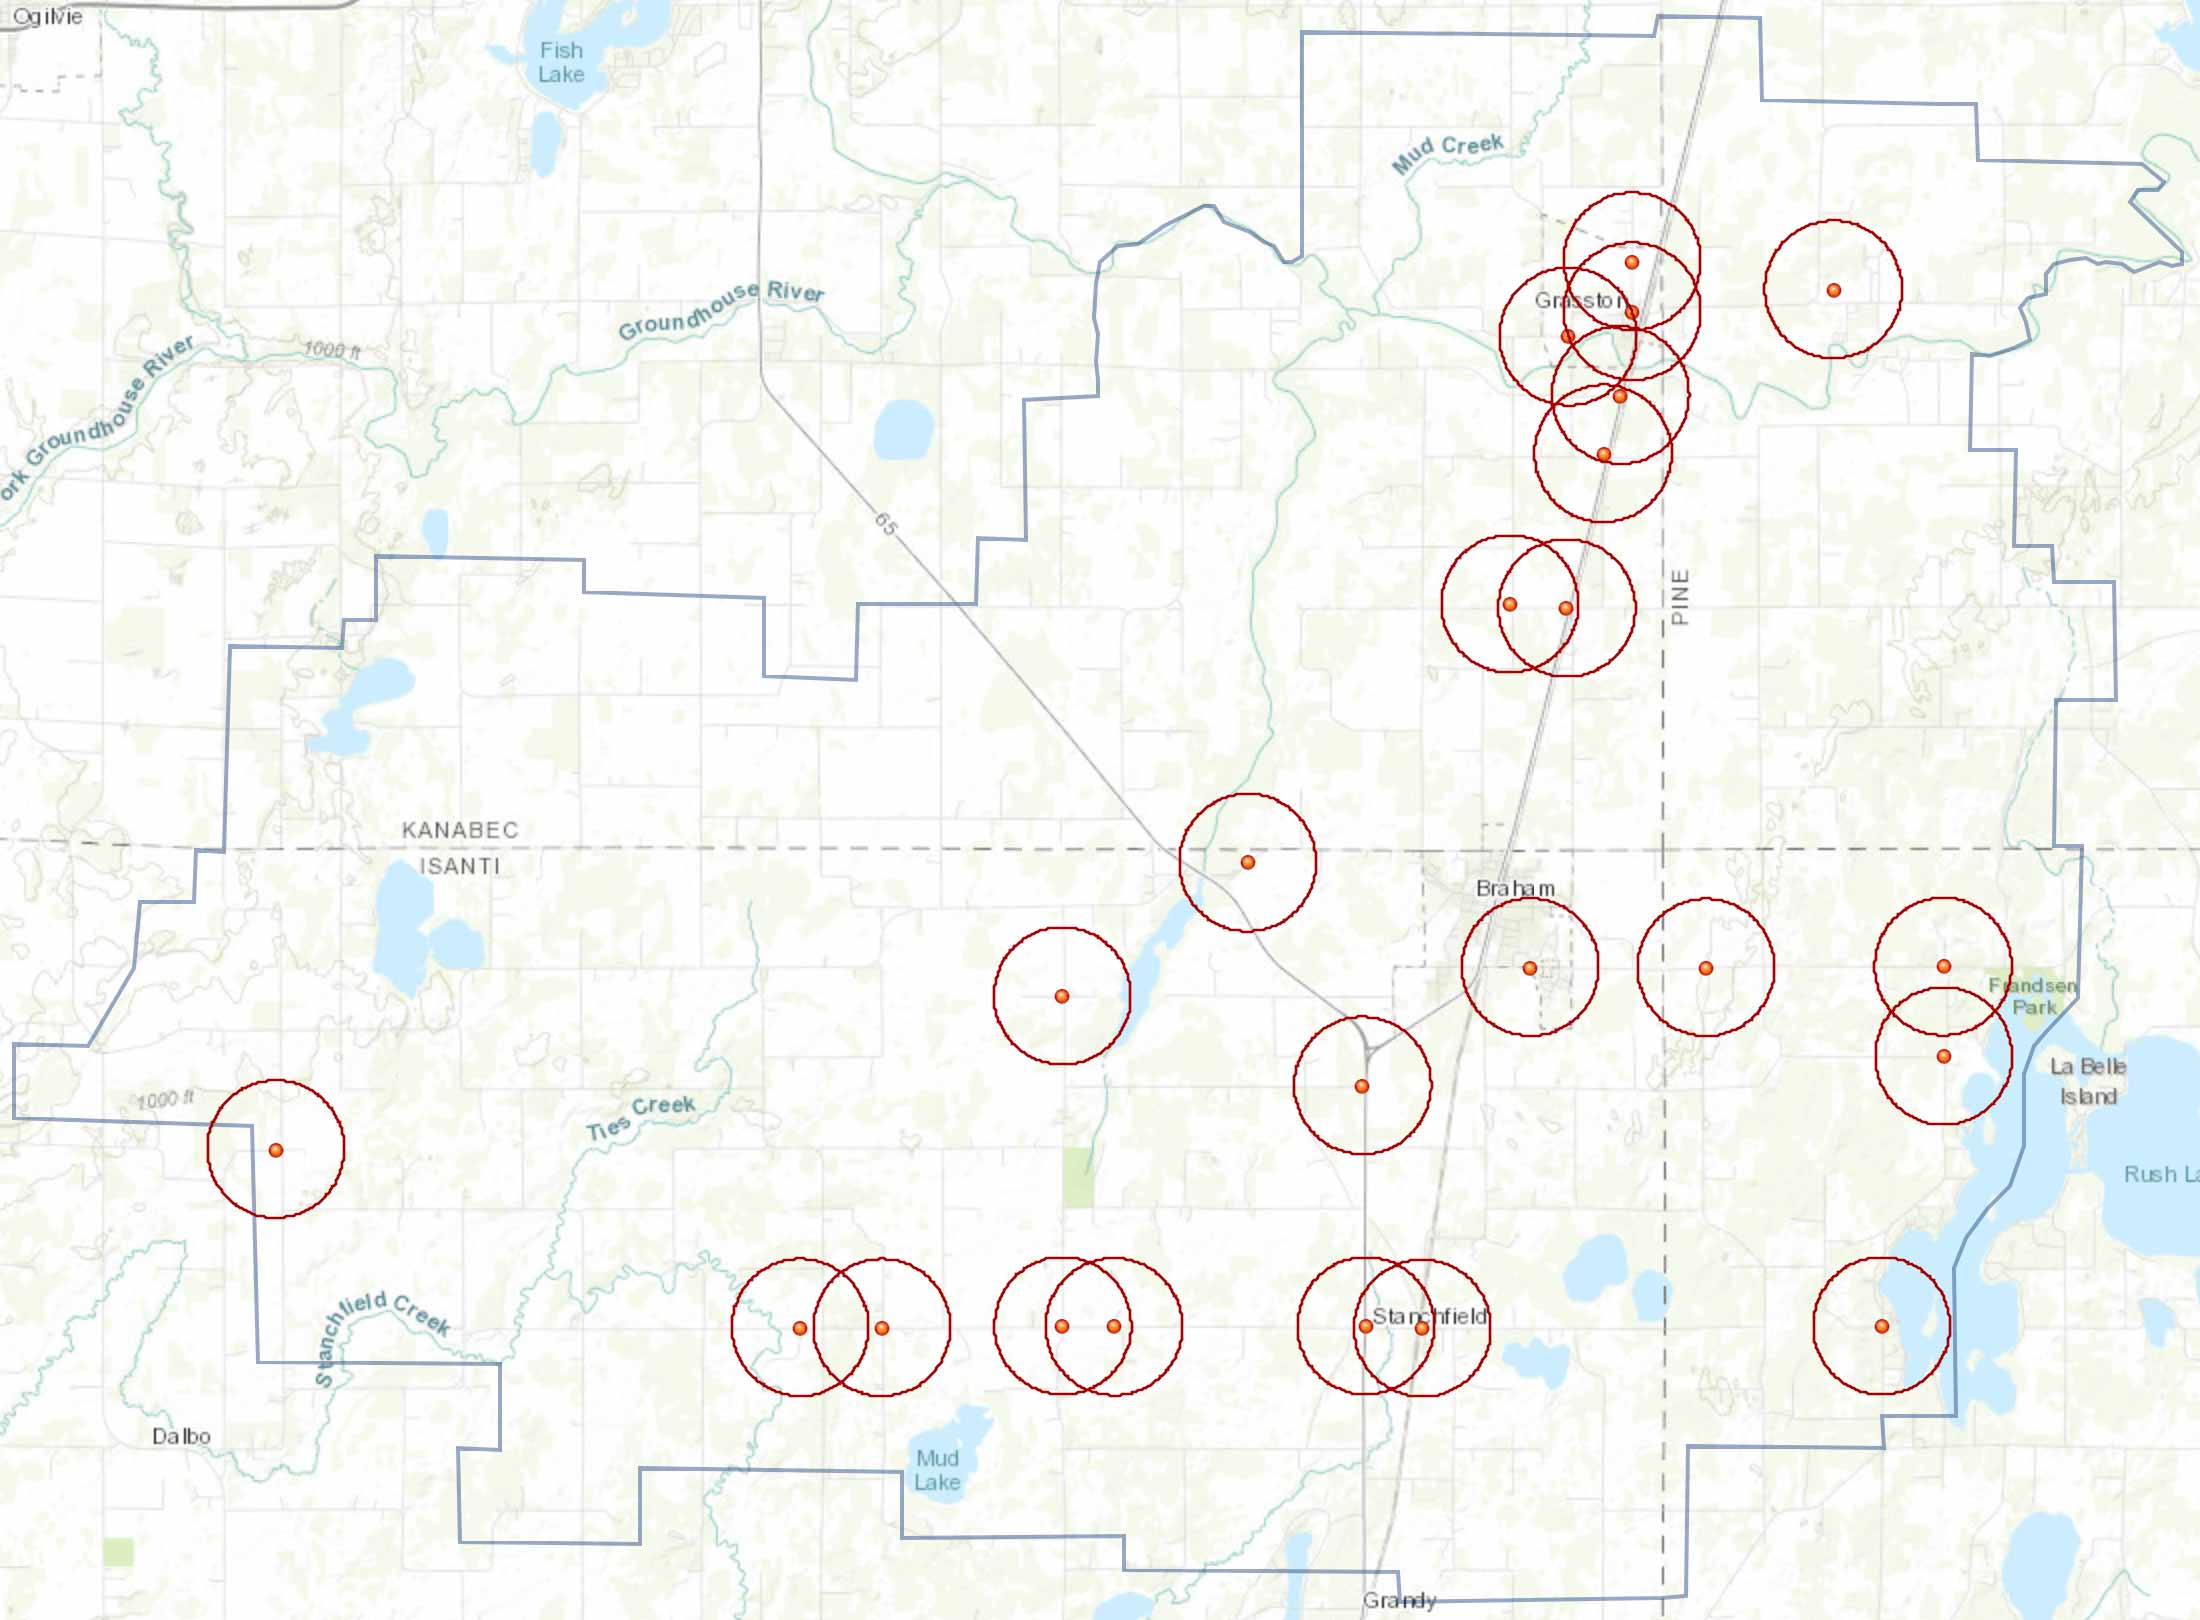
Without feedback from CenturyLink, it is unknown whether or not the carrier has completed its CAF II-funded deployments in this area. It is possible that CenturyLink will install additional fiber and electronics in the future. From the consumer and community perspective, however, the upgrades deployed to date leave many areas unserved. People living in areas left behind see their neighbors getting service but don’t know whether, or if, they too eventually will be served.